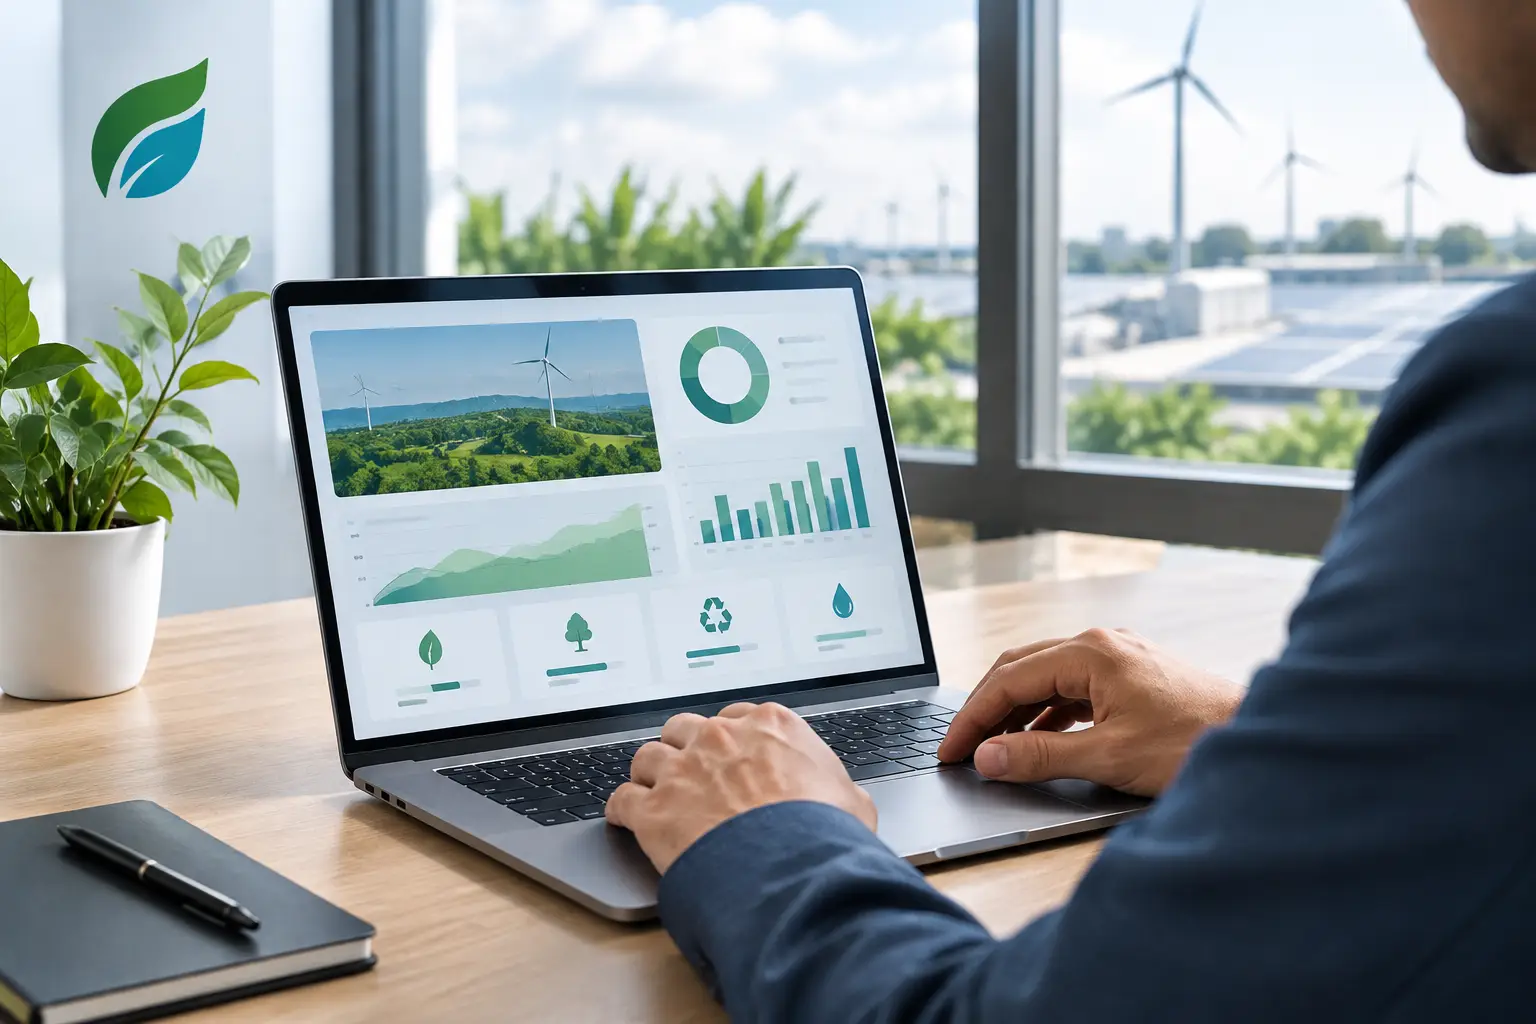
A factory can have solar generation, energy meters and monthly utility bills, yet still lack a clear answer to a basic commercial question: what drove yesterday’s energy cost? The best sustainability dashboard features turn disconnected operational data into decisions that protect margin, support uptime and evidence environmental performance.
For industrial and commercial energy users, a dashboard should be more than a reporting screen. It should show what is happening now, forecast what is likely to happen next and, where appropriate, enable smarter control of energy assets.
What the best sustainability dashboard features should deliver
The right feature set depends on a site’s tariff structure, operating profile, solar capacity and battery strategy. A high maximum-demand user may place demand management first. A multi-site organisation with ESG obligations may need consistent reporting and audit-ready data. In both cases, the dashboard must connect sustainability performance to operational and financial outcomes.
Real-time energy visibility by asset and area
Site-level consumption is useful, but it rarely explains the cause of a demand spike. Enterprise users need live visibility by meter, production line, building, HVAC system, air compressor, solar inverter and battery system.
This level of granularity helps facilities and engineering teams identify abnormal load behaviour before it becomes a costly pattern. It also makes ownership clearer. When a consumption increase is linked to a specific asset or zone, teams can investigate the operational reason rather than debating the accuracy of a monthly bill.
Demand and peak-load intelligence
For many medium-voltage sites, maximum demand charges are a material part of the electricity bill. A dashboard should track present demand against historical peaks, contractual thresholds and expected demand for the current billing period.
The stronger platforms do not only show a peak after it has occurred. They use forecasting to flag developing risk, giving operators time to reschedule flexible loads, reduce non-essential consumption or dispatch stored energy. This is where monitoring becomes commercially useful: real savings, not theoretical efficiency claims.
Solar performance in operational context
Solar reporting should go beyond total kilowatt-hours generated. Decision-makers need to see solar generation alongside site load, self-consumption, grid import and export. That view reveals whether on-site renewable energy is being used at the most valuable time.
Features such as solar prioritisation and generation forecasting are particularly valuable where production schedules vary. If a site consumes most of its energy after solar output falls, the answer may not be additional panels alone. Load shifting, battery storage or different control logic may produce a better commercial result.
Intelligent BESS monitoring and control
Battery energy storage systems require more than a state-of-charge indicator. An effective dashboard should show charge and discharge activity, available capacity, battery health, dispatch history and the value created through peak shaving or tariff optimisation.
The best systems combine these views with intelligent battery control. They can reserve capacity for an anticipated demand event, charge when conditions are favourable and support critical loads when grid conditions are unstable. Automation must still be configurable around site priorities. A plant with strict uptime requirements may value resilience above short-term tariff savings.
Actionable alerts, not alert fatigue
Alerts should direct attention to events that merit action: unusual baseload, inverter underperformance, a developing demand breach, battery availability issues or a sensor reading outside an agreed operating range. Every alert needs a clear threshold, responsible owner and practical next step.
Too many generic notifications train teams to ignore the dashboard. Role-based alerts are more effective, allowing operations teams to manage equipment exceptions while finance or sustainability leaders receive concise performance and savings updates.
Sustainability reporting that stands up to scrutiny
A useful sustainability dashboard brings energy, cost and emissions into the same reporting environment. For Malaysian organisations responding to Energy Efficiency and Conservation Act 2024 requirements, this can reduce the manual effort of consolidating site information and preparing management reporting.
Scope 1 and Scope 2 reporting
Scope 1 and Scope 2 reporting features should provide transparent calculation methods, reporting periods and source data. Users need to understand whether emission reductions arise from lower consumption, improved solar self-consumption, renewable procurement or changes in emission factors.
Traceability matters. A board report may show a headline reduction, but the supporting data must be available when a renewable energy manager, auditor or internal stakeholder asks how that figure was derived.
Management reporting for different decisions
One dashboard cannot present every user with the same view. Engineering teams need equipment-level exceptions and operating data. Finance teams need demand charges, avoided costs and savings trends. Sustainability teams need emissions intensity, renewable contribution and consistent reporting boundaries.
A well-designed Management Reporting System gives each role the information required without hiding the underlying operational evidence. Amsolar AI applies this approach by linking physical energy assets to AI-led monitoring, optimisation and automated control in one enterprise environment.
Choose features that can move from insight to control
Visibility alone does not lower electricity costs. When assessing a platform, ask whether it can integrate with meters, solar systems, environmental sensors, HVAC equipment, air compressors and BESS assets already on site. Then ask what happens after an anomaly or forecast is identified.
A dashboard that supports demand control, load shedding, solar prioritisation and battery dispatch can help teams act at the speed required by live energy operations. However, automated control should be engineered with safeguards, approval rules and operational constraints. Not every load is flexible, and not every peak should trigger the same response.
The strongest sustainability dashboards make energy performance visible, defensible and manageable. Choose one that gives your teams a clearer view of the next decision, not simply a cleaner view of the last month.