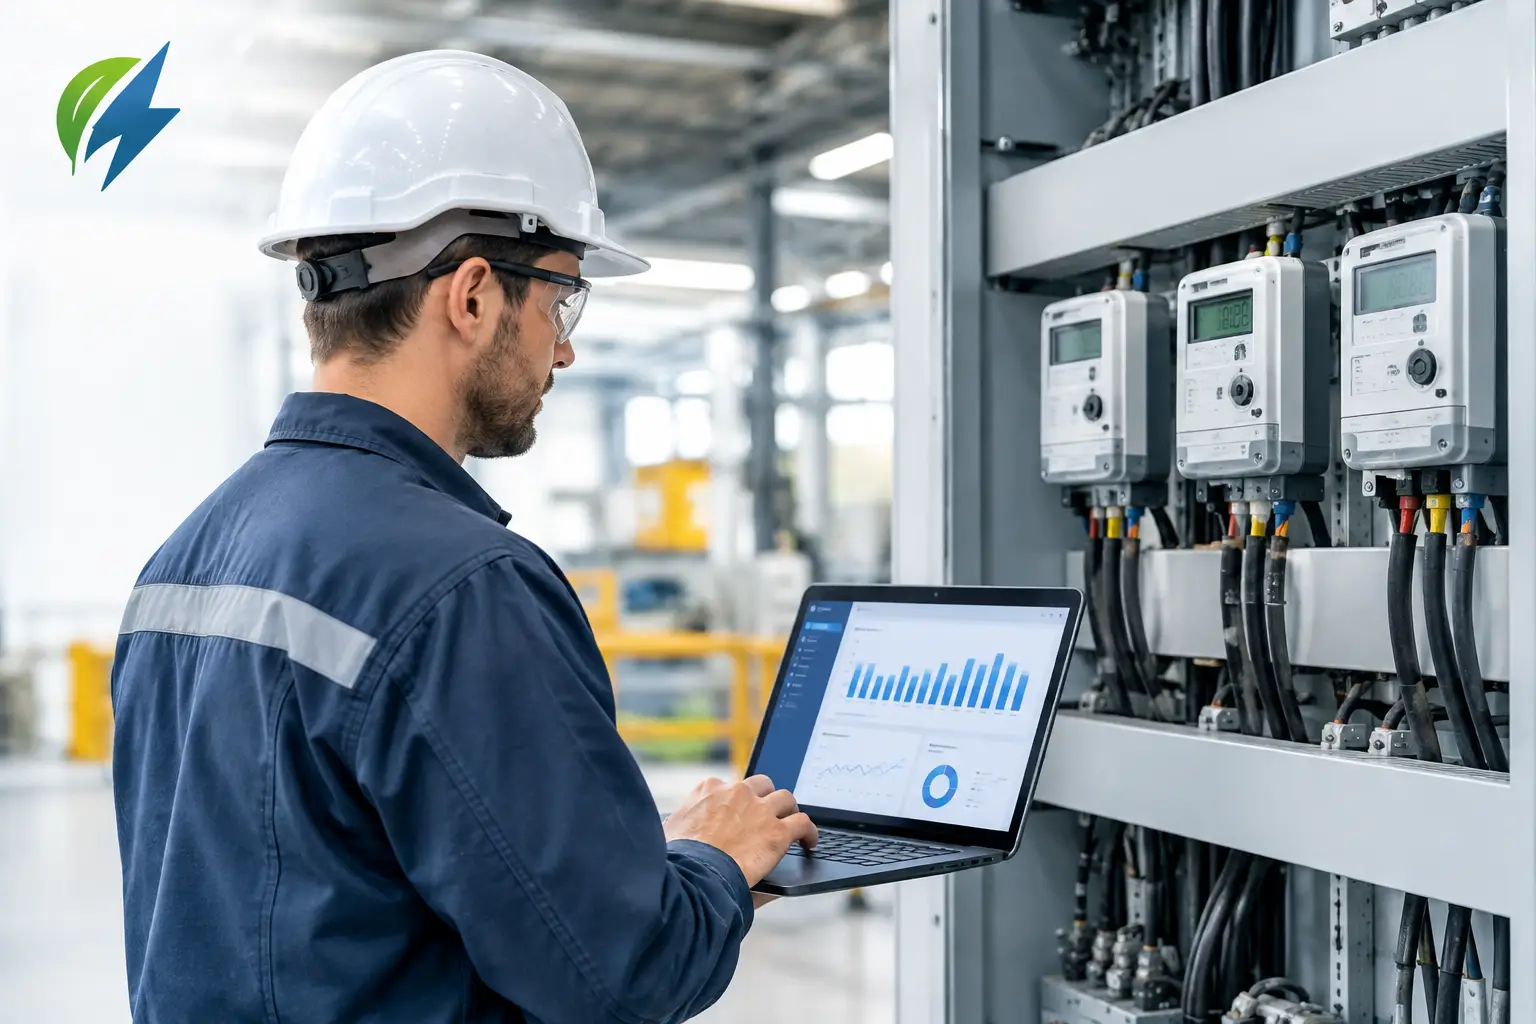
A factory can consume thousands of pounds of electricity before the main utility meter reveals where the cost originated. A monthly bill may show total kWh, maximum demand and tariff charges, but it cannot explain whether an air-compressor bank, chilled-water plant, production line or poorly timed process caused the peak. This industrial submetering guide explains how to turn that blind spot into operational control.
For medium-voltage industrial and commercial users, submetering is not simply a reporting exercise. It is the measurement layer that supports demand reduction, solar prioritisation, battery dispatch, maintenance planning and credible ESG reporting. The value comes when data is sufficiently accurate, timely and structured to change a decision before the next billing cycle.
What industrial submetering measures
Industrial submetering uses secondary meters to measure electricity consumption and power quality beyond the incoming utility meter. Rather than viewing a site as one combined load, the energy team can track individual buildings, distribution boards, major machines, tenant areas or energy-intensive processes.
A well-designed system typically measures kWh consumption, real-time kW demand, voltage, current, power factor and, where relevant, harmonics. These readings establish both how much energy an asset uses and how it behaves at particular times. A compressor may have acceptable daily consumption but be responsible for a short, expensive demand spike. A production line may draw power overnight when no scheduled output is planned. These are different problems, requiring different actions.
The practical scope depends on the site. A single facility may need meters at the main incomer, each major distribution board, the solar inverter connection, BESS connection, HVAC plant and compressed-air system. A multi-building campus may also require metering by cost centre, tenancy or operational department.
Why visibility alone is not enough
More meters do not automatically create savings. Industrial teams already manage enough dashboards, spreadsheets and month-end reports. The commercial case for submetering is strongest when every measurement point has a defined operational or financial purpose.
Start with the decisions the organisation needs to make. These may include identifying avoidable maximum-demand events, verifying solar self-consumption, allocating energy costs between production areas, detecting equipment operating outside schedule, or proving the impact of an efficiency project. Meter placement should follow these use cases, not a generic wiring diagram.
For example, metering a central chiller plant can reveal its demand profile and consumption intensity. Adding contextual data from temperature, operating hours and production levels can show whether rising consumption is justified by conditions or signals a control issue. The same principle applies to air compressors, where pressure, run time and loading data can expose waste that kWh data alone may not explain.
This is where next-generation energy management moves beyond passive monitoring. Real savings, not theoretical estimates, require teams to connect measurement with alerts, forecasting and action.
Designing an industrial submetering strategy
Begin with the utility bill and single-line diagram
The utility bill identifies the tariff mechanics that shape financial exposure. If maximum demand charges are significant, interval data and high-resolution kW monitoring should be central to the design. If time-of-use pricing applies, the system needs to distinguish consumption by tariff period. Where solar or battery assets are present, import, export and behind-the-meter generation must be measured in a coordinated way.
The electrical single-line diagram then shows where loads can be segmented safely and meaningfully. Work with qualified electrical engineers to confirm available panel space, CT sizing, communications routes, voltage ratings and isolation requirements. A meter installed at the wrong point may produce data, but not a useful operational answer.
Prioritise material loads
Do not attempt to meter every circuit on day one. Focus first on assets that account for a meaningful share of energy use, influence maximum demand or create operational risk. For many sites, these include HVAC systems, compressors, pumps, chillers, furnaces, cold rooms, process equipment and large motor loads.
A sensible first phase often captures the main incomer, renewable generation, battery system and the highest-demand distribution boards. This establishes a reliable energy balance. Subsequent phases can isolate priority processes once the initial data shows where deeper visibility will deliver a return.
Specify data quality, not just hardware
Meter accuracy matters, but it is only one part of data quality. The system should provide consistent timestamps, suitable interval resolution, reliable communications and clear asset naming. A reading that arrives late, is assigned to an unclear location or cannot be reconciled with the main meter limits its value in commercial reporting.
For demand management, interval data should be frequent enough to identify developing peaks before they become costly. For billing allocation and ESG reporting, traceable data governance is essential. The aim is a single source of truth that engineering, finance and sustainability teams can use with confidence.
Turning submeter data into cost control
Submetering creates the evidence base for energy optimisation. The next step is to use that evidence in daily operations.
Consider a facility where the incoming meter records repeated peak events at the start of the morning shift. Submeter data may show that compressors, HVAC plant and process equipment are all starting within the same interval. The remedy may be simple sequencing, a staggered start, revised setpoints or controlled load shedding. If a BESS is available, intelligent battery control can discharge during the predicted peak rather than responding after the charge has already been incurred.
Solar performance also becomes more valuable when matched against site demand. A solar generation meter alone shows production. Combined with feeder-level consumption, it shows whether generation is serving onsite loads, being curtailed or exported when controllable demand could have been shifted. This supports solar prioritisation based on actual operating conditions rather than assumptions.
At Amsolar AI, this measurement layer can feed enterprise-grade AI controllers and Management Reporting System capabilities, combining live monitoring with forecasting, demand control and automated optimisation. The engineering principle remains straightforward: control decisions are only as dependable as the signals behind them.
Reporting for operations, finance and ESG
Different stakeholders need different views of the same energy system. Operations teams need exception alerts and equipment-level trends. Finance teams need cost allocation, demand-charge visibility and verified savings. Sustainability leaders need auditable consumption data that supports Scope 2 reporting and energy-performance commitments.
An effective reporting structure avoids forcing every user into the same dashboard. Instead, it connects each report to a decision. A weekly operations report might flag overnight baseload and abnormal run hours. A monthly management report might compare demand peaks, solar self-consumption and cost per production unit. A compliance report can retain the data trail needed to support Energy Efficiency and Conservation Act 2024 requirements.
Submetering can also improve project verification. When a new variable-speed drive, control upgrade or compressor replacement is installed, a dedicated meter makes it easier to separate genuine savings from changes in production volume, weather or operating hours. That strengthens investment decisions and reduces disputes over performance.
Common mistakes that weaken results
The most common error is treating the main meter as the only point of truth. It is essential for utility reconciliation, but it cannot diagnose internal energy behaviour. Another is installing meters without integrating them into a management platform, leaving teams to manually collect and interpret fragmented data.
Poor asset labelling creates a quieter but costly problem. If a dashboard says “Meter 17” rather than identifying the feeder, location and served load, the data becomes difficult to act upon. Equally, do not ignore maintenance. CT orientation, communications health, meter calibration and data gaps should be checked as part of routine system governance.
Finally, avoid measuring without assigning ownership. A peak alert needs a named response process. A recurring overnight load needs an operations owner. Data can identify the opportunity, but accountable action delivers the saving.
Make every measured kilowatt useful
The strongest industrial submetering programme is built around decisions, not devices. Measure the loads that influence cost, uptime and carbon performance; connect those measurements to a reliable control environment; then act while the operating window still exists.
A well-planned first phase can create the clarity needed for smarter control across solar, batteries, HVAC and production assets. That is a practical route to a cleaner, future-ready energy system, with measurable results visible in both the plant room and the profit and loss account.